

GetApp offers objective, independent research and verified user reviews. We may earn a referral fee when you visit a vendor through our links.
Our commitment
Independent research methodology
Our researchers use a mix of verified reviews, independent research, and objective methodologies to bring you selection and ranking information you can trust. While we may earn a referral fee when you visit a provider through our links or speak to an advisor, this has no influence on our research or methodology.
Verified user reviews
GetApp maintains a proprietary database of millions of in-depth, verified user reviews across thousands of products in hundreds of software categories. Our data scientists apply advanced modeling techniques to identify key insights about products based on those reviews. We may also share aggregated ratings and select excerpts from those reviews throughout our site.
Our human moderators verify that reviewers are real people and that reviews are authentic. They use leading tech to analyze text quality and to detect plagiarism and generative AI.
How GetApp ensures transparency
GetApp lists all providers across its website—not just those that pay us—so that users can make informed purchase decisions. GetApp is free for users. Software providers pay us for sponsored profiles to receive web traffic and sales opportunities. Sponsored profiles include a link-out icon that takes users to the provider’s website.
10 Top Rated Software For Data Analysis
This data analysis software list can help you analyze data for decision making and performance evaluation in almost all areas of business.


Data is generated in real time from different sources. But capturing, processing, and analyzing data with the same speed can be challenging because it is usually in the form of codes or numeric values.
As a data analyst or data scientist, you need to juggle multiple spreadsheets to manually structure and analyze data to identify business insights and trends. Without the right set of tools, you are likely to end up with an inaccurate analysis that leads to inefficient business decisions.
The solution? Data analysis software.
From extracting meaningful insights by analyzing raw, unstructured data to improving validity through quantitative research, data analysis software helps make accurate predictions about business trends instead of relying on intuition. But, with ample options out there, how do you find the best data analysis software for your business?
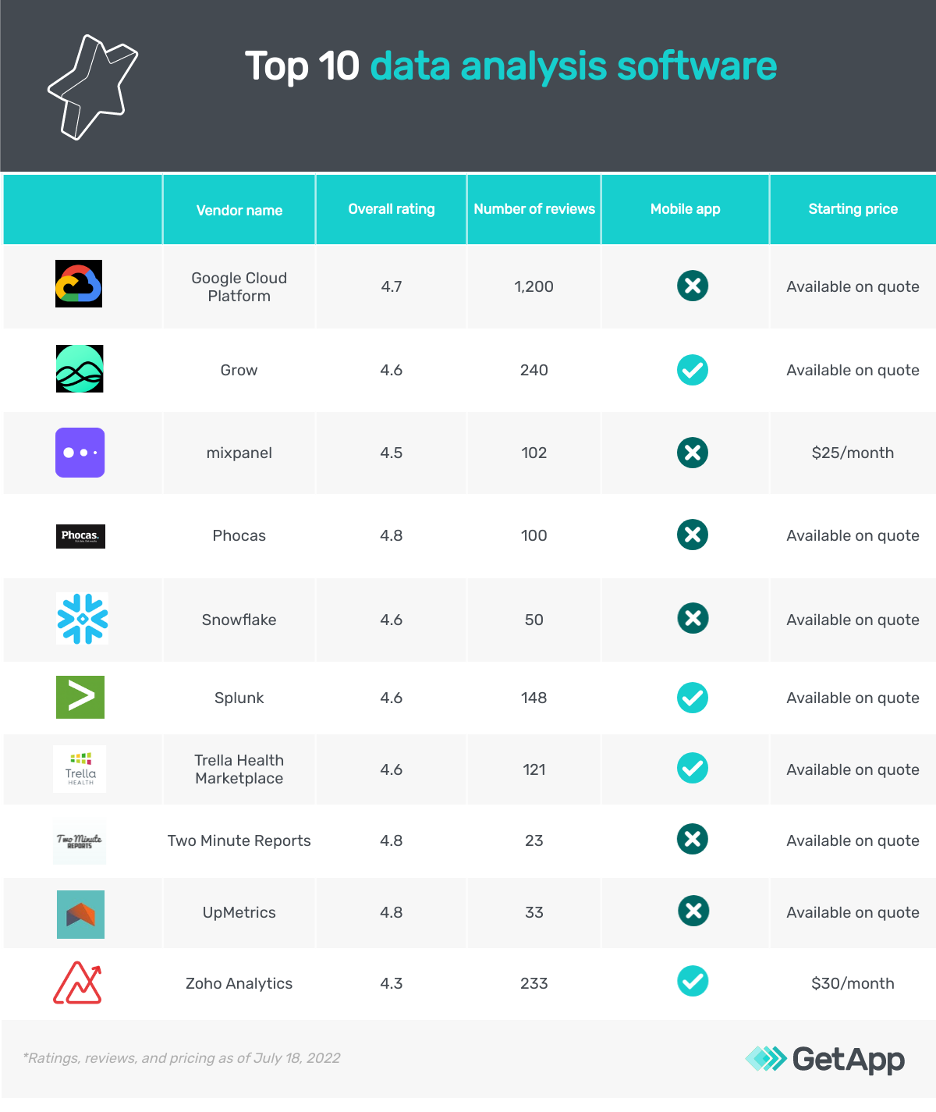
To make your search for data analysis software easier, we created this list of the 10 best data analysis software solutions from GetApp’s catalog. (Products are sorted alphabetically. Read how we shortlisted these best software for data analysis at the bottom of this page.)
1. Google Cloud Platform
Offers a software suite for data processing
Google Cloud Platform (GCP) is a software suite that offers data processing and analysis features through Dataflow and BigQuery tools. With Dataflow, you can analyze data using unified stream and batch processing methodologies, while BigQuery offers a data warehouse to store and manage processed structured data.
You can pull in the data from the intended internal or external source and analyze it for business insights and trends. All the processed data is stored using BigQuery to present in your desired format and language, and facilitate decision-making.
Google Cloud Platforms uses a global fiber network to facilitate data and network security. You can use customer-managed encryption keys, private IPs, and VPC service control to further secure your data from cyberattacks and unauthorized access.
The software offers 24/7 chat and on-call support for software-related queries.
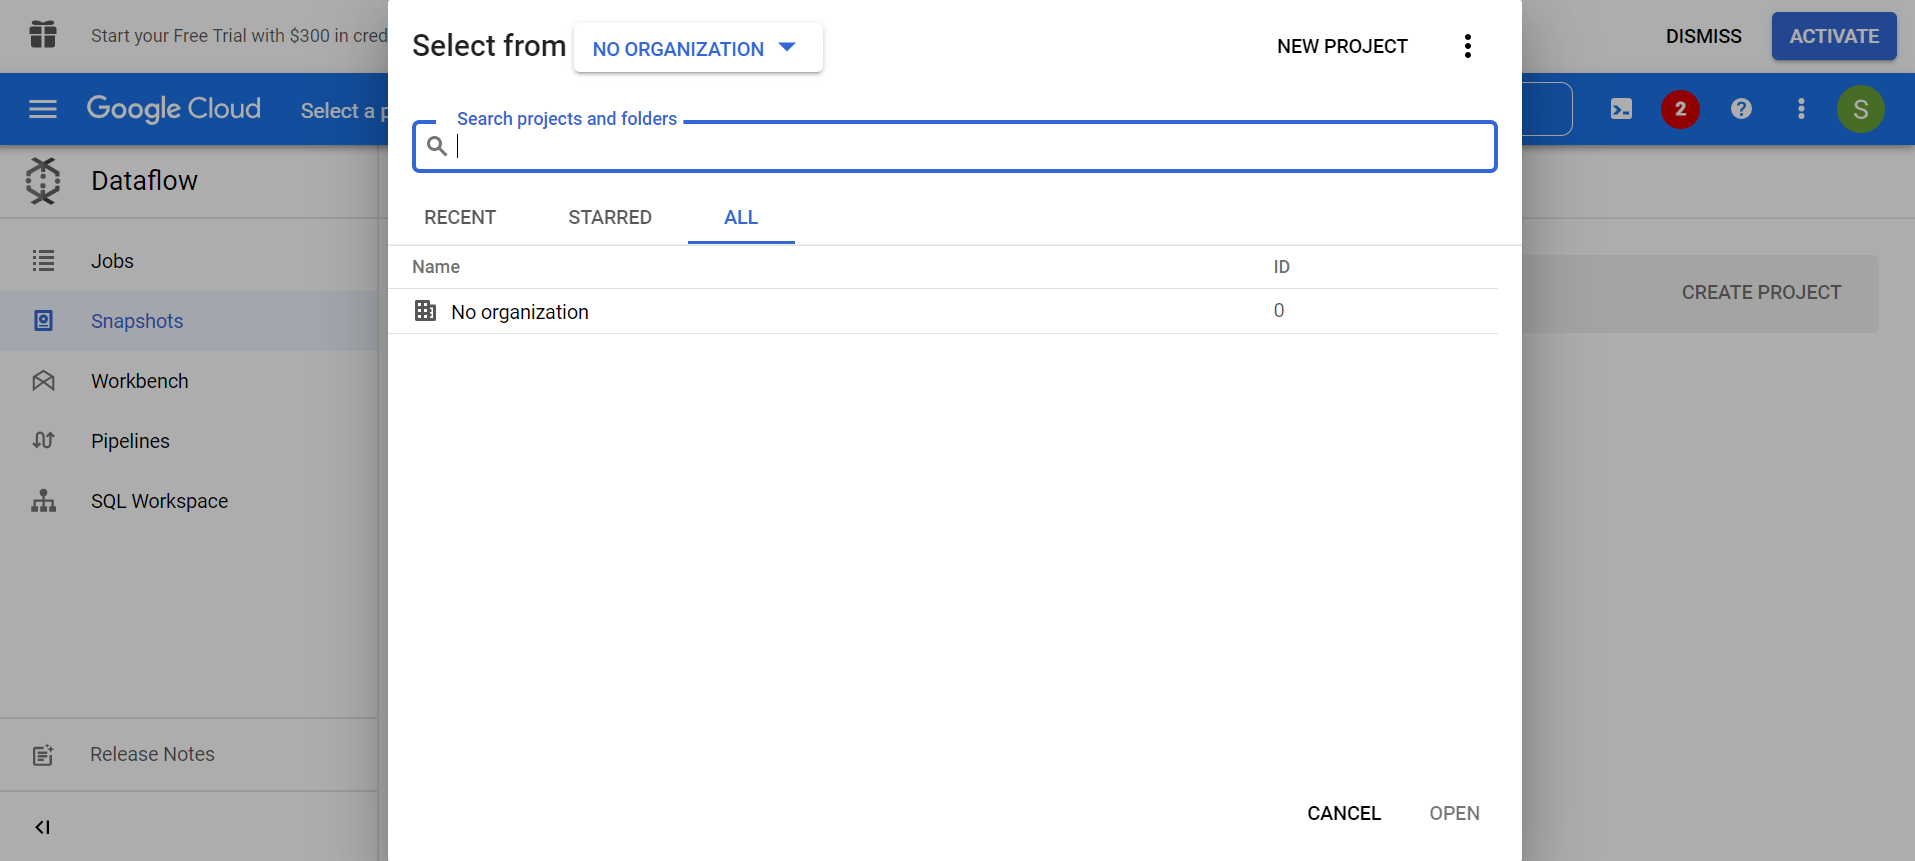
New project in GCP Dataflow (Source)
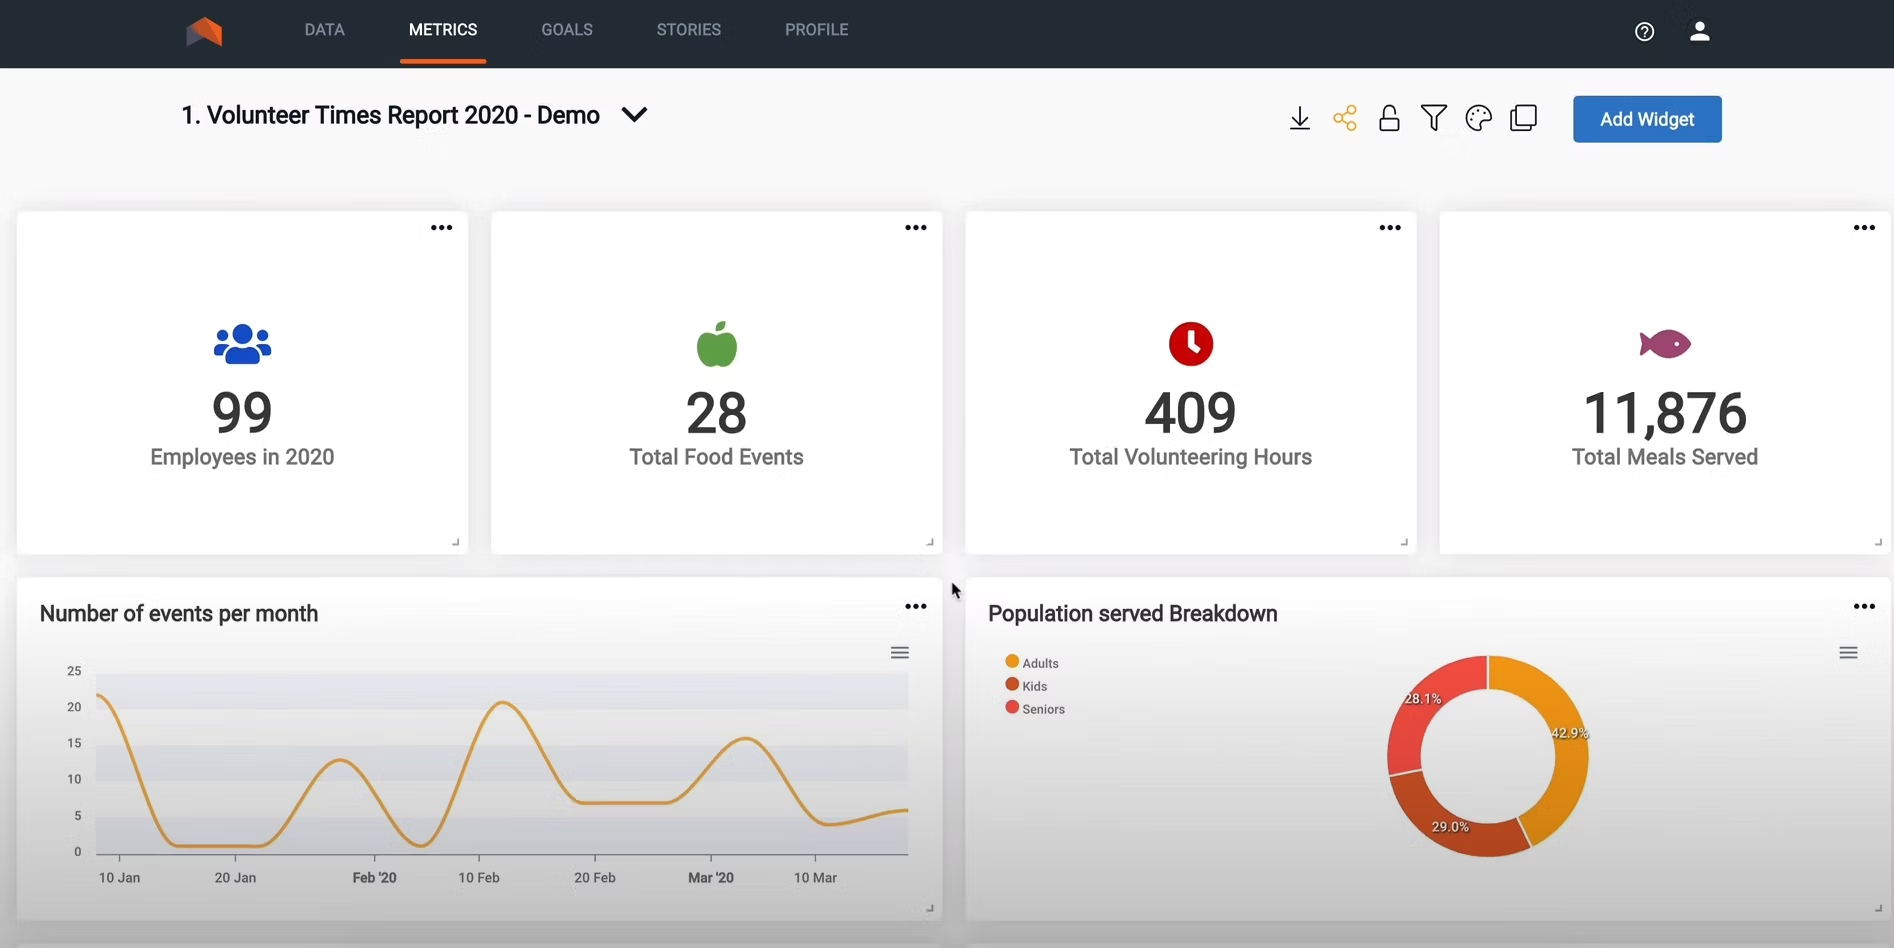
2. Grow
Provides customizable data analysis reports
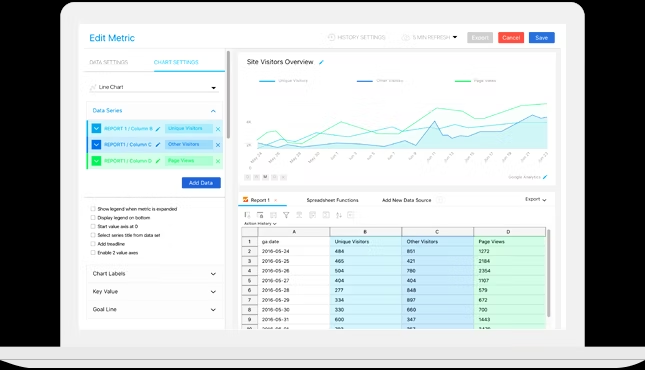
Grow is a no-code data analysis software designed to help you capture, cleanse, and transform unstructured data into actionable insights for business decision-making. The tool offers an intuitive metrics builder dashboard to customize your reports from the analysis. You can filter the data for specific metrics, sort the lists, create or rename a tag column, and much more.
You can also connect Grow with other commonly used applications for data storage, processing, and analytics such as CRM, marketing analytics, or social media to import data. It gives you the ability to pull out specific data points instead of importing the entire database. You can assign and authorize access to the stored data for added security.
To access the analysis reports on the go, Grow has a mobile application for Android and iOS devices. It offers email and on-call customer support for software and purchase related queries.
3. Mixpanel
Enables ad-hoc data analysis
Mixpanel is a self-service data analysis tool that lets you convert, engage, and retain more customers. Using the tool, you can perform ad-hoc analysis to answer a single, immediate business query such as a quick comparison between the sales of two products. The ad-hoc analysis report can be included in your full-blown data analysis report for combined results.
Mixpanel’s team dashboard enables you to monitor the performance of multiple products in real time. You can customize the dashboard to view specific performance metrics such as increased sales and trigger alerts whenever the number peaks or declines.
Mixpanel offers email and on-call customer support for software related issues.

4. Phocas Analytics
Imports data from different software platforms
Phocas Analytics is a cloud-based software suite that facilitates data analysis through its analytics tool. Phocal Analytics can also import data from multiple applications such as CRM or ERP software. The combined database can be used to discover company-wide insights through historic and predictive analytics.
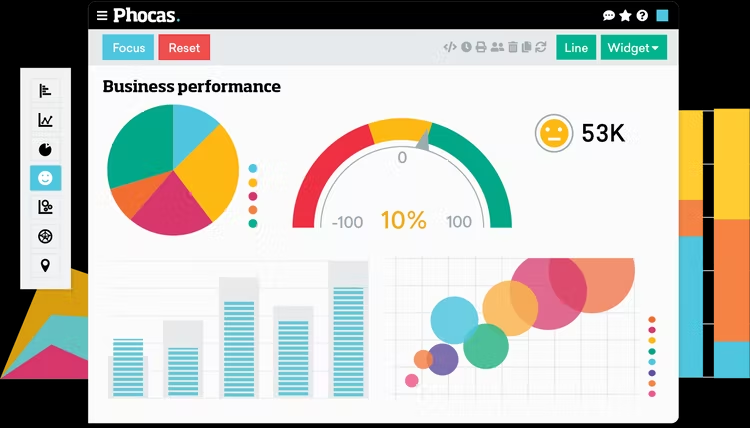
Using the software’s visualization tools such as charts or graphs, you can present the insights from raw data in a concise report to facilitate decision-making. In addition, you can include specific performance metrics in your report that are in line with your business objectives.
Phocas Analytics offers on-call and email customer support for software related queries.
5. Snowflake
Allows secure data sharing across organizations
Snowflake is a tool that offers a suite solution for data warehousing, data lake, and data analysis. With built-in data storage, you can securely share critical business data directly from the tool’s dashboard with relevant stakeholders.
Snowflake’s data sharing feature helps you determine who’s viewing your data in real time. You can control access to shared data, monitor usage, and control the publishing workflow. In addition, the tool’s data discovery feature lets you set a request approval process to grant access to data and provide personalized views for each of the stakeholders.
Snowflake offers email and on-call support to its customers.

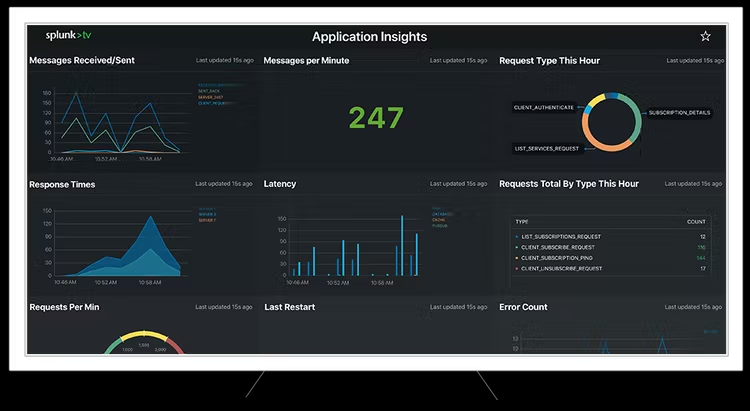
6. Splunk
Offers predictive alerts about changes in data
Splunk is data analysis software that helps you manage big data and analyze machine data. The tool’s AI-assisted troubleshooting helps you detect critical patterns in your business’s data to identify problems and take corrective measures.
Splunk’s smart alerting feature keeps you and other stakeholders updated on any changes in the data in real time. It predicts changes in the data based on the historical reports to prevent delays in getting the job done.
Splunk has a mobile application for Android and iOS devices where you can receive alerts, access dashboards, take action with your data, and much more on the go. The tool offers email and on-call customer support.
7. Trella Health
Provides access to physician-level performance metrics
Trella Health is a healthcare data analysis software that enables hospitals, hospice, and nursing facilities to discover new opportunities and enhance service by leveraging data. You can use the tool to analyze the performance of your physicians against high-risk patients and identify the factors that are likely to help them reach the benchmark.
With Trella Health, you can monitor your patients with metrics such as readmissions, retention, and acquisition. In addition, you can track which distribution channels work best for specific practice types to attract more patients.
Trella Health has a mobile application for Android and iOS devices. The tool offers on-call, chat, and email customer support for software related queries.
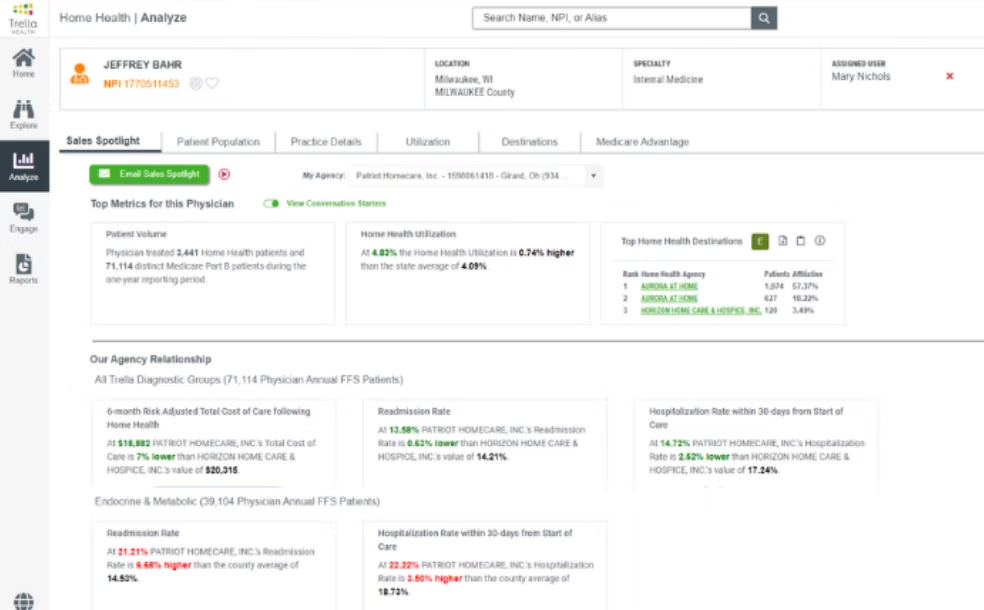
Physician profile in Trella Health (Source)
8. Two Minute Reports
Offers add-on for Google Sheets and Data Studio
Two Minute Reports is a self-service data analysis platform that can be downloaded as an add-on feature for Google Sheets and Google Data Studio applications. This means you can schedule automatic data transfer to Google Sheets and Data Studio applications from your system’s database.
Using Two Minute Reports, you can create interactive reports in the form of charts, bars, and graphics. The tool lets you duplicate existing reports, run your reports on auto-pilot, and configure role-based permissions to allow access to reports across organizations.
Two Minute Reports offers email and chat support to its users.
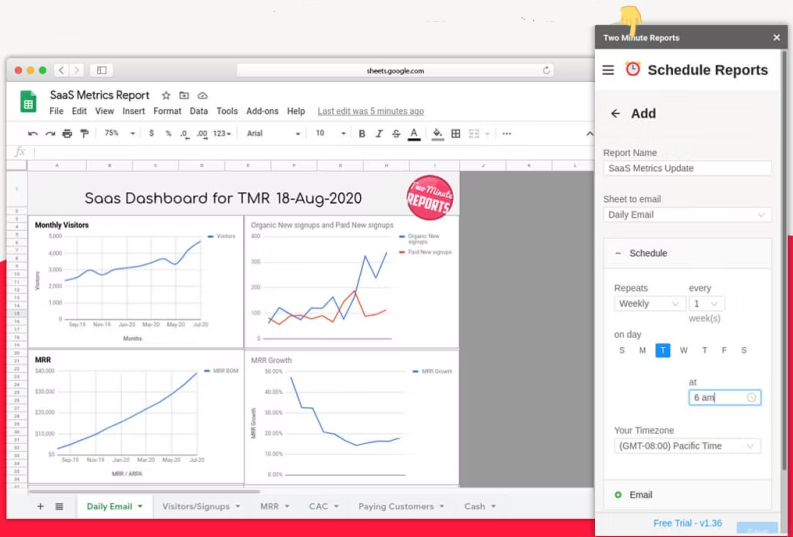
Report Scheduling in Two Minutes Reports (Source)
9. UpMetrics
Offers survey tools to collect data
UpMetrics is a data analysis software designed to collect data with survey tools (such as quizzes and questionnaires) and store them in a centralized repository. The collected data can be pulled out for analysis and visualization through a customizable dashboard with metrics filtered based on your current business objectives.
With the UpMetrics sharing tool, you can combine quantitative and qualitative data and build reports. Share reports and send alerts to stakeholders on any changes such as adding new data points or highlighting changes in business trends.
UpMetrics offers email support to customers for software usage and subscription-related queries.
10. Zoho Analytics
Enables dashboard sharing with access controls
Zoho Analytics is self-service business intelligence software that offers data analytics solutions such as collaborative analytics. The feature enables you to share the reports you create with your stakeholders for their views and feedback. You can start a comment thread and collaborate with peers on a report or dashboard, add and annotate images, or check the comment history.
With Zoho Analytics, you can have full control over the dashboard sharing with specific options such as read-only, read and write, or report authoring. In addition, you can publish your reports and make them available on the internet across websites and blogs.
Zoho Analytics has a mobile application to access and interact with the created or shared reports and dashboards. The application is available for Android and iOS devices. Zoho Analytics offers email and chat support to users.
Interactive reports in Zoho Analytics (Source)
How to choose data analysis software for your business
The following are key considerations for selecting the best data analytics software for your business.
Assess the data source integration: Some data analysis tools integrate with multiple data sources while others are limited to one or two. You can also download data analysis tools as an additional feature to your application such as Google Sheets. However, this feature varies for different software applications, so you will need to check your chosen software’s process .
Check the report and dashboard sharing feature: While most data analysis software enables report sharing and collaboration, the dashboard sharing feature is limited to a few software applications and number of users. Be sure to check if the collaboration feature offered by your chosen software is in line with your requirements to make an informed decision.
Look for data visualization options: A data visualization tool is essential as it helps present insights from raw data in a readable format such as charts and graphs. Graphical representation of data helps better identify relationships and patterns between data points. Look for data analysis software that offers multiple visualization options to create interactive reports.
Common questions to ask software vendors when selecting data analysis software
Ask the following questions to data analysis software vendors to ensure you find the best match for your business needs.
How many users can access the dashboard? Sharing the analytics dashboard is a limited feature and the allowed number of users varies for different software and the type of subscription plan. Check the allowed number of users to access the dashboard for your selected software based on your team size and desired team members within a project.
What are the dashboard access control options available? Data analysis software solutions typically offer access control options such as read-only, read and write, or report authoring. The options are to enhance the security of information and avoid any unauthorized access to the dashboard. Check the access control options offered by your selected software before signing the purchase deal.
How to import data from external sources for analysis? There are multiple options to import data from external sources. You can integrate the data analysis software with your data source such as cloud storage or download the analysis software as an add-on to your data processing application. However, it is important to check the availability of options with your selected data analysis software to find the right match for your requirements.
How did we choose these products? We didn’t—you did
At GetApp, we verify all our user reviews to recommend the most efficient tools for your business.
Our software recommendations reflect the views and experiences given by your peers. These recommendations are never bought or sold, nor based on the opinion of a single individual.
For this article we selected the highest rated products as of July 18, 2022, from our GetApp's Category Leaders report for Data analysis software. Check out the full methodology description for Category Leaders report here.
1. Each product should have at least 20 unique product reviews published on GetApp within the past two years, with an average rating of 3.0 or higher as of July 18, 2022.
2. Have data discovery as a primary feature along with data visualization and predictive analysis.
3. Each product must meet our market definition for data analysis software: “Data Analysis software is used to uncover relationships within existing data. Like Business Intelligence software, Data Analysis software is used in decision support and performance evaluation in almost all areas of business.”
The 10 products with the highest ease of use, functionality, customer support, value for money, and likelihood to recommend are featured in this article from the GetApp Category Leaders for data analysis software.
Disclaimer: We conducted this analysis based on reviews and ratings data as of July 18, 2022. In order to present the most up-to-date information, the product cards show real-time ratings. Please note that this means the ratings value in the product card may not reflect the ratings value at the time of analysis.
More on Business Intelligence


May 03, 2024


Dec 22, 2023