

GetApp offers objective, independent research and verified user reviews. We may earn a referral fee when you visit a vendor through our links.
Our commitment
Independent research methodology
Our researchers use a mix of verified reviews, independent research, and objective methodologies to bring you selection and ranking information you can trust. While we may earn a referral fee when you visit a provider through our links or speak to an advisor, this has no influence on our research or methodology.
Verified user reviews
GetApp maintains a proprietary database of millions of in-depth, verified user reviews across thousands of products in hundreds of software categories. Our data scientists apply advanced modeling techniques to identify key insights about products based on those reviews. We may also share aggregated ratings and select excerpts from those reviews throughout our site.
Our human moderators verify that reviewers are real people and that reviews are authentic. They use leading tech to analyze text quality and to detect plagiarism and generative AI.
How GetApp ensures transparency
GetApp lists all providers across its website—not just those that pay us—so that users can make informed purchase decisions. GetApp is free for users. Software providers pay us for sponsored profiles to receive web traffic and sales opportunities. Sponsored profiles include a link-out icon that takes users to the provider’s website.
What is Descriptive Analytics? A Definition
Descriptive analytics is the foundation of all business analytics. In this article, we’ll look at a definition of descriptive analytics and how you can use it to achieve your business goals.


Business Intelligence (BI) tools and data science can seem like magic at times, uncovering hidden trends from reams of raw data and empowering business leaders like you to make the right decisions and achieve key initiatives, even when resources are limited.
Descriptive analytics forms the foundation of business intelligence, as we’ll break down in this article. It provides business leaders with answers to the questions surfaced by crude data and helps them make decisions to guide their business in the right direction.
In fact, our recent Martech Research survey (methodology below) found that 72% of respondents considered their analytics tools to be either moderately (46%) or very (26%) effective at helping them achieve company goals.
But BI tools can also feel arcane to new and less experienced users, with complex interfaces and a seemingly endless stream of new terms and acronyms.
Business analytics are only useful if users can understand them, and descriptive analytics is the bridge between impenetrable, raw data and actionable insight.
Let’s take a closer look at descriptive analytics, starting with a definition.
What is descriptive analytics? A definition
Descriptive analytics is a type of data analysis that helps business leaders distill raw data into an actionable and easy-to-understand format that answers the question, “What happened?”
In fact, Gartner defines descriptive analytics as “the examination of data or content … to answer the question “What happened?” (or What is happening?), characterized by traditional business intelligence (BI) and visualizations such as pie charts, bar charts, line graphs, tables, or generated narratives.”
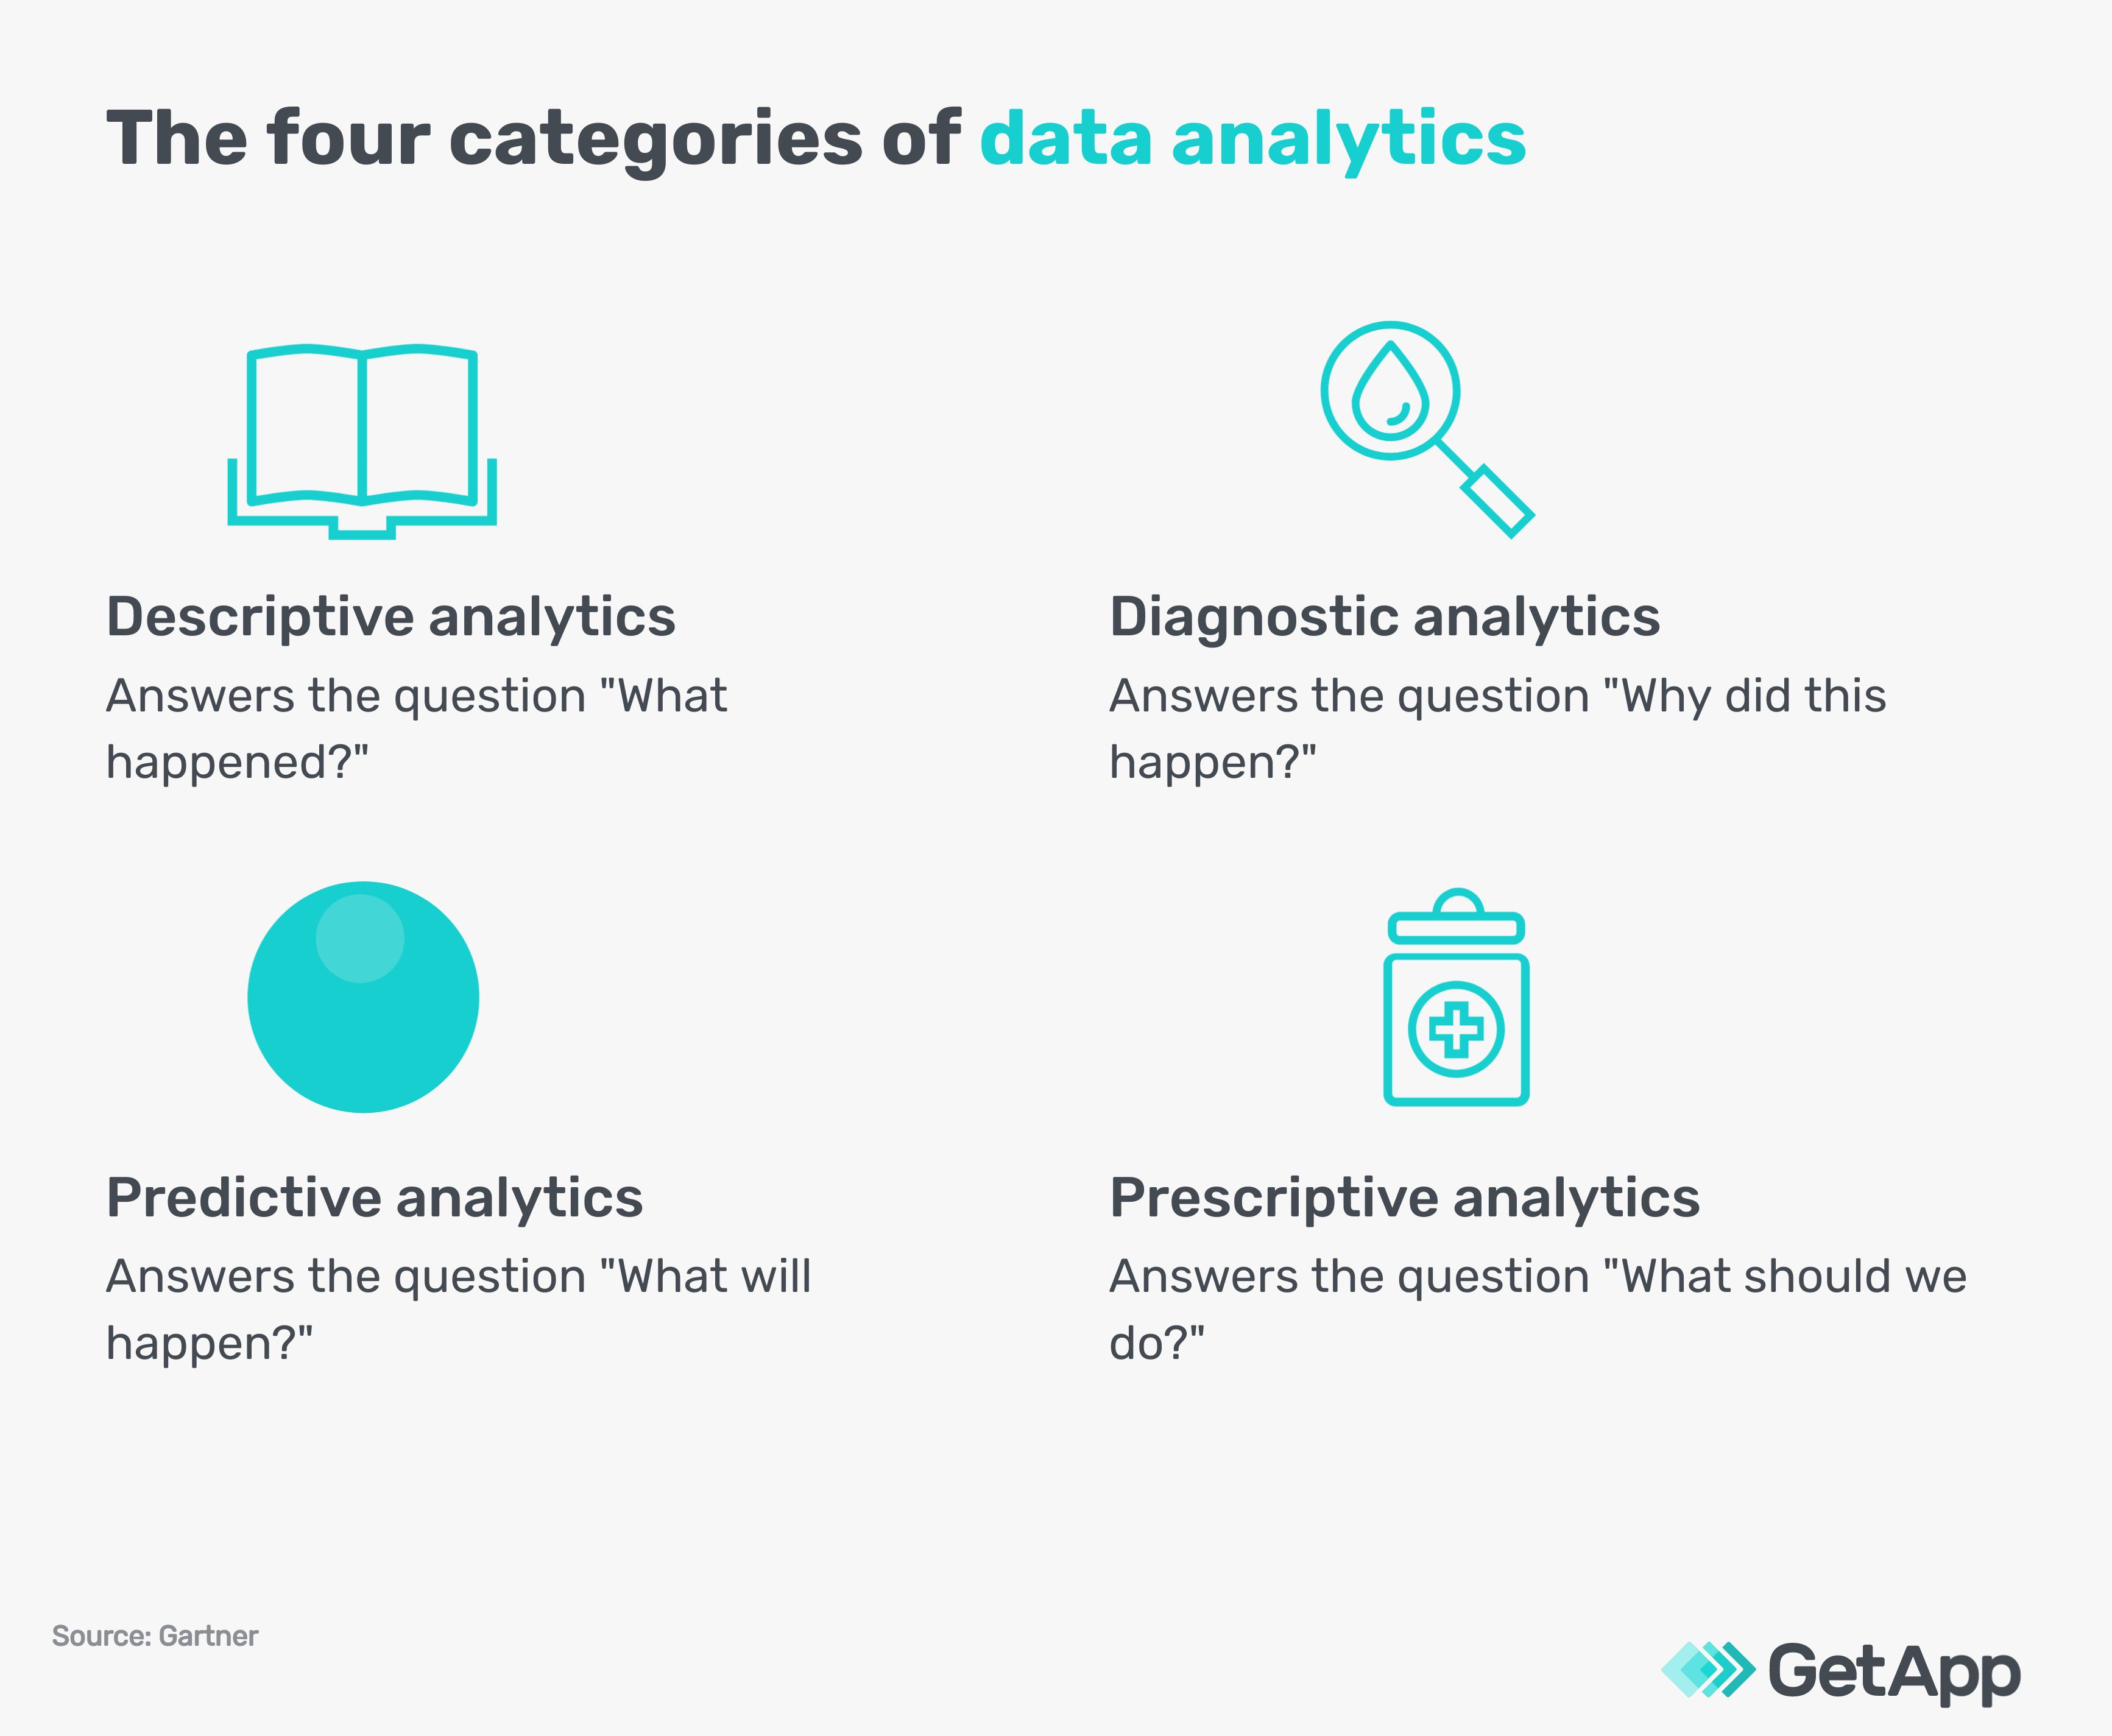
Descriptive analytics is one of the four main categories of data analytics, along with diagnostic analytics, predictive analytics, and prescriptive analytics.
Data analytics allows businesses to examine large volumes of data methodically, and descriptive analytics, in particular, helps business leaders gain clarity into the historic performance of their business.
It provides the foundation for all business analytics.
For example, if a produce supplier had a decline in revenue from one quarter to the next, descriptive analytics might help pinpoint the source of that decline as a drop in orders of tomatoes in a specific market among a demographic during a week. In comparison:
Diagnostic analytics helps understand why this happened: A drought caused less flavorful tomatoes.
Predictive analytics helps determine what will happen: An ongoing water shortage will lead to more low-quality tomatoes.
Prescriptive analytics helps navigate what the produce supplier should do: Research a new variation of tomatoes that requires less water.
Once this information has been uncovered using data analytics, the next step is to summarize and distribute key findings. Data visualization helps users package and present those key findings in an easily understandable format so that they can be shared with stakeholders.
As you can imagine, each of these types of data analytics can be greatly beneficial to businesses, but they all start with descriptive analytics.
Ready to get started with data analytics at your business? Here’s a short video to help you get started on the right foot:
How to perform basic descriptive analytics
While software can take a lot of the legwork out of data analysis, it is possible to run descriptive analytics using just a spreadsheet. (Note that you’ll need the Analysis ToolPak add-in for Excel to perform more complex analytics.)
If your business is relatively small, your data set is mostly contained to one or two sources, or you don’t have the resources to invest in a business intelligence platform, you might be a good candidate for performing descriptive analytics with a spreadsheet.
Once you have your chosen data set in your spreadsheet (for example, monthly sales data), you can use the descriptive statistics function to generate basic statistics like total sales, average revenue per sale, and standard deviation.
Here are a few examples of businesses that might benefit from basic descriptive analytics using only a spreadsheet:
A landscaping company trying to determine average revenue per job
A florist trying to determine year-over-year customer growth
A mechanic trying to determine the total number of jobs completed per month
Want to see it in action? Check out a tutorial showing how to pull some simple descriptive statistics in Microsoft Excel:
Descriptive statistics in Excel (Source)
Using descriptive analytics to help your business
Unless you’re a data analyst or data scientist (or you have one on staff, in which case, you’re ahead of the game), you’re probably wondering where to even start with your data analysis.
Descriptive analytics should be your first stop when running data analytics because descriptive analytics (“What happened?”) informs the other three types of analytics.
This can be both an advantage and a drawback. On one hand, descriptive analytics provides the foundation for all business intelligence. But on the other hand, descriptive analytics only helps reveal what happened without directly revealing why it happened, what might happen next, or what you should do.
For this reason, descriptive analytics should never be the end of the story. It should always lead into diagnostic analytics, predictive analytics, and/or prescriptive analytics.
Descriptive analytics is also most useful when performed regularly. For example, you can’t generate month-over-month sales data if you only run analytics a few times per year when you notice a dip or a spike in revenue. This is where BI dashboards that automatically keep track of historic data can be especially helpful.Rather than wrestling with financial reports and pouring through spreadsheets of historical data to perform a descriptive analysis manually, it is highly recommended that business leaders leverage a BI tool to streamline this process and save time.
Here is a basic four-step process for using descriptive analytics to gain valuable insight into your business performance:
Select a BI tool that integrates with your existing software. Our BI software directory allows users to filter by integrations with hundreds of different platforms. Your accounting software may also have a marketplace of BI apps to browse such as QuickBooks.
Determine which metrics you want to investigate. Examples include revenue, new customers, and social media engagement. Refer to your business goals, and where you’re falling short as a starting point.
Pull and prepare relevant data. Depending on the type of metric you’re investigating, this data set could come from your accounting and finance software, your marketing software, or your ERP software.
Use your BI tool to perform a descriptive analysis. This process will differ depending on the specific tool, but all tools should allow users to prepare reports and charts to present to stakeholders and save dashboards to run again in the future.
Tips to scale your business using descriptive analytics
As you become comfortable using descriptive analytics, you’ll be ready to track more statistics, present your findings, use BI software, and move into diagnostic, predictive, and prescriptive analytics. Here are some tips for scaling your descriptive analytics efforts as your business grows:
Keep it simple at first. It can be overwhelming to keep track of a dozen descriptive statistics right away. Start small with a few revenue-based metrics (average sales, month-over-month revenue, total customers, etc.) and scale up as you become more accustomed.
Start early. The earlier you start tracking metrics, the more useful your historic data will be. Even if you start with a spreadsheet, that data can be imported into your BI tool as you scale up.
Transition into advanced analytics. Descriptive analytics is useful for keeping tabs on how your business is doing, but it’s even more useful when helping you decide what to do next.
Invest in a BI tool. When you’re starting out, you can use a spreadsheet to run some basic descriptive analytics. But as your business grows, a BI tool can save you lots of time and effort and help you dig even deeper into your business data.
Make descriptive analytics the first stop on your BI journey
Now that you are familiar with the definition of descriptive analytics, its applications, and tips for scaling to your business needs, you might be ready to explore more BI tools and resources. GetApp has you covered.Check out these related articles from our resource library:
GetApp's Top-Rated Analytics and Data Software Tools for the Future of Work in 2022
Future of Business Analytics: 5 Predictions for 2025 and Beyond
Ready to start browsing BI software?
Our Business Intelligence Buyers Guide has all the information you need before starting your BI software buying journey, and our Category Leaders in Business Intelligence highlights 15 top options in BI software based on verified user reviews.
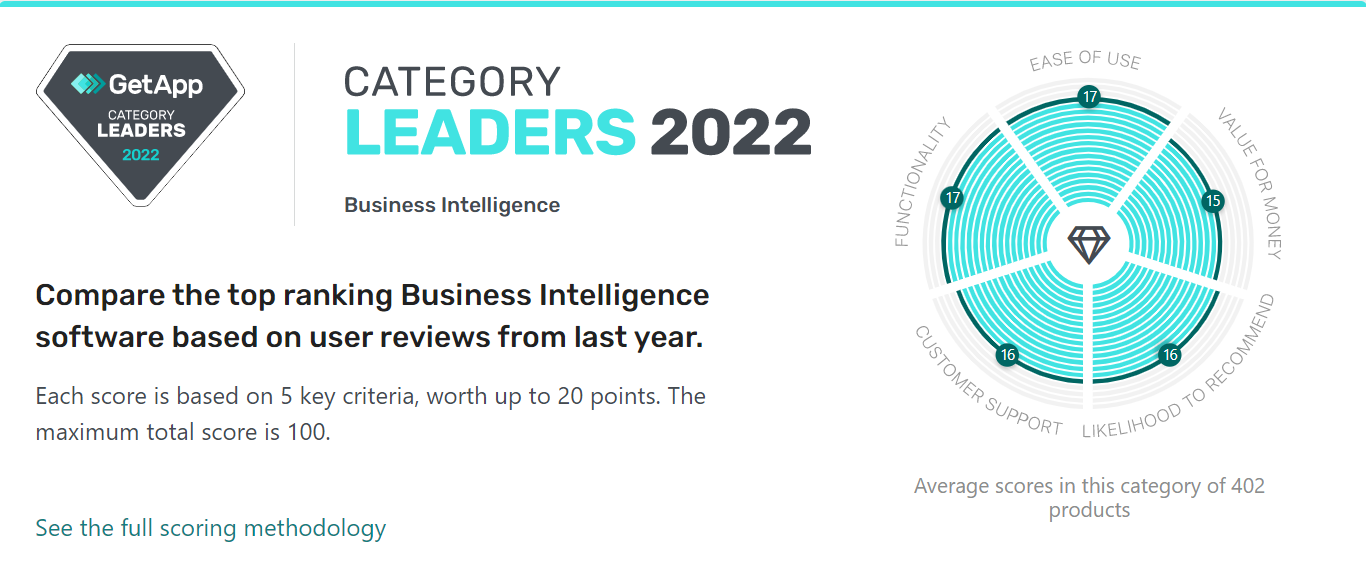
GetApp’s Category Leaders in Business Intelligence (Source)
Methodology
GetApp conducted the Martech Research survey in October 2021 among 663 U.S. respondents to learn more about small to midsize business martech usage and effectiveness. Respondents were screened for full-time small to midsize business workers (500 or less employees). They must have used marketing or CRM software within the past two years with a minimum of 150 respondents that are martech influencers or buyers.
Note: The applications selected in this article are examples to show a feature in context and are not intended as endorsements or recommendations. They have been obtained from sources believed to be reliable at the time of publication.
As a seven-time award winner in the Maryland, Delaware, D.C. and Suburban Newspapers of America editorial contests, Andrew’s work has been featured in the Baltimore Sun and PSFK. He lives in Austin with his wife, son, and their rescue dog, Piper.
mentioned in this article


More on Business Intelligence


May 03, 2024


Dec 22, 2023