GetApp offers objective, independent research and verified user reviews. We may earn a referral fee when you visit a vendor through our links.
Our commitment
Independent research methodology
Our researchers use a mix of verified reviews, independent research, and objective methodologies to bring you selection and ranking information you can trust. While we may earn a referral fee when you visit a provider through our links or speak to an advisor, this has no influence on our research or methodology.
Verified user reviews
GetApp maintains a proprietary database of millions of in-depth, verified user reviews across thousands of products in hundreds of software categories. Our data scientists apply advanced modeling techniques to identify key insights about products based on those reviews. We may also share aggregated ratings and select excerpts from those reviews throughout our site.
Our human moderators verify that reviewers are real people and that reviews are authentic. They use leading tech to analyze text quality and to detect plagiarism and generative AI.
How GetApp ensures transparency
GetApp lists all providers across its website—not just those that pay us—so that users can make informed purchase decisions. GetApp is free for users. Software providers pay us for sponsored profiles to receive web traffic and sales opportunities. Sponsored profiles include a link-out icon that takes users to the provider’s website.
How To Measure Customer Satisfaction
Not sure how to measure customer satisfaction? We’ve put together some simple metrics and tools to check if a customer is happy or unhappy with your services.


Customer satisfaction is key to the growth of your business. Happy, satisfied customers mean repeat purchases, a loyal clientele, favorable word-of-mouth, pleasant social media comments, and positive brand recall.
But how do you know for sure if customers are satisfied with your products and services? Are there ways to measure customer satisfaction quantitatively? Thankfully, yes! Even though “satisfaction” is an abstract emotion, there are various metrics and tools to measure it.
In this article, we walk you through three customer experience metrics that assist with measuring customer satisfaction. We also discuss some tools you can use to check if buyers are satisfied with your products and services.
3 popular customer satisfaction metrics
Famous management expert Peter Drucker said, “If you can’t measure it, you can’t improve it.” Therefore, to improve customer satisfaction, you should first be able to first measure it. Here are three common metrics used to quantify the customer satisfaction level.
1. Customer satisfaction score (CSAT)
CSAT is a customer satisfaction metric that measures how positive or negative a customer’s experience has been with your business. It’s calculated based on customer responses to the following CSAT question (or its variants), usually delivered via an online or offline survey.
Q: How would you rate your overall satisfaction with the service or product you received?
The choices are usually categorical variables: very satisfactory, satisfactory, neutral, unsatisfactory, and very unsatisfactory.
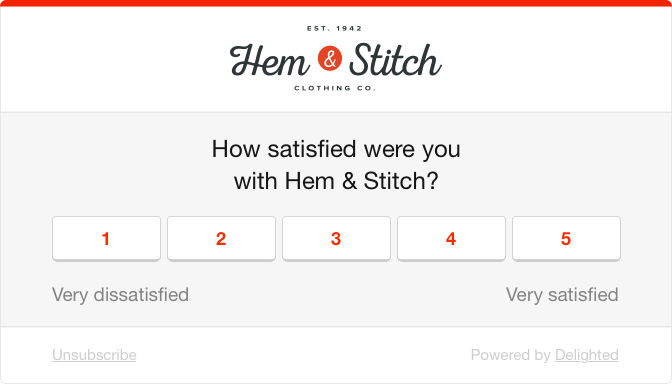
The CSAT score represents the percentage of customers who choose positive responses (satisfied or very satisfied) over neutral or negative ones.
CSAT = (Number of customers who responded “satisfied” or “very satisfied” x 100) / Total number of responses)
The higher the number of positive responses, the better your customer satisfaction score. You can use CSAT for measuring customer satisfaction at different interaction points; for example, during the first meeting with a salesperson, soon after a sale, or after a support ticket is resolved. It’s also helpful in tracking customer feedback before and after you’ve made a change (e.g., added or removed a feature) to your product or service.
Here’s a graph tracking CSAT scores during different stages of a customer’s journey.
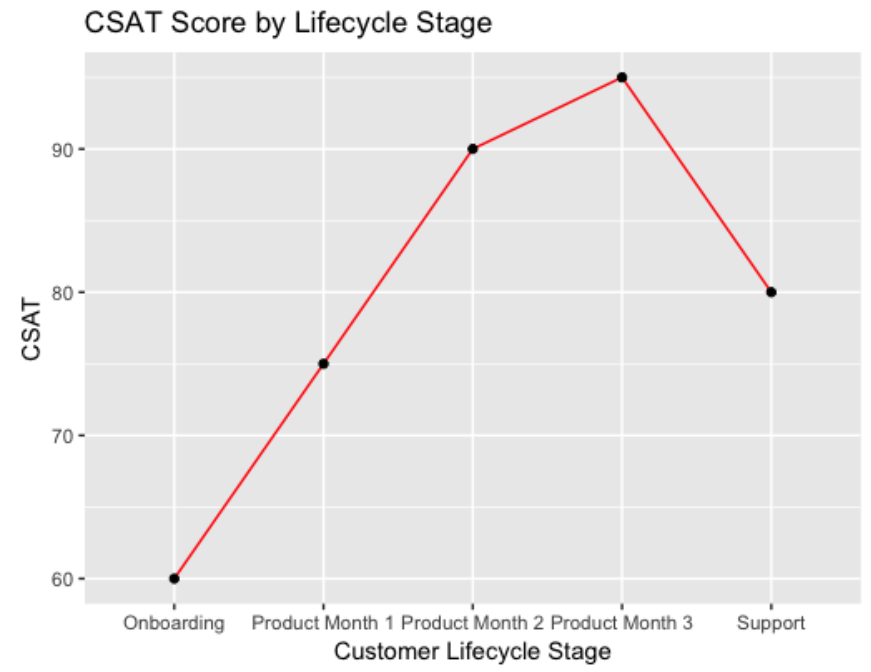
CSAT scores in different stages of a customer journey (Source)
Pros and cons of CSAT
Let’s discuss the pros and cons of using CSAT to check if it can be useful for your business case.
| Pros | Cons |
|---|---|
| Pinpoints specific experiences that customers are satisfied or dissatisfied with | Not very intuitive, as the term “satisfaction” can be viewed differently by different users |
| Allows the use of flexible rating systems—numeric (1-5), emojis (smiling and upset emojis), and categorical scales (very dissatisfied to very satisfied) | Needs follow-up questions to understand why customers are satisfied or dissatisfied with an experience |
2. Net promoter score (NPS)
NPS helps measure the customer satisfaction level by looking at loyalty parameters. It’s calculated based on customers’ responses to the question below.
Q: On a scale of 1 to 10, how likely are you to recommend our product or service to a friend?
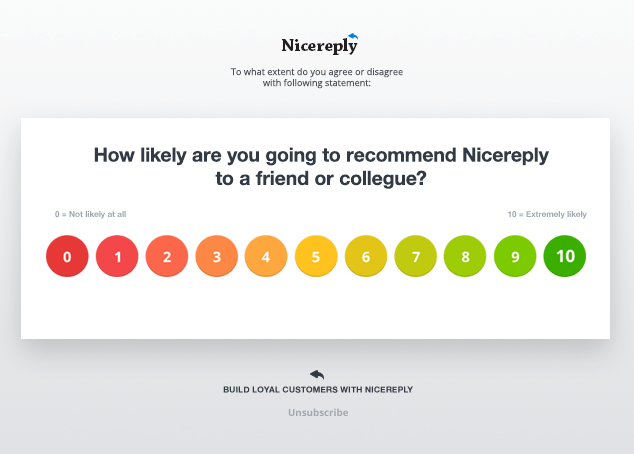
Based on NPS survey responses, you can divide your customers into three groups:
Promoters: Customers who responded with a 9 or 10. These are loyal customers who make repeat purchases and refer your brand to friends and family.
Passives: Customers who responded with a 7 or 8. Though these customers shop with you, they’ll likely move to a competitor if they find a better price, product, or feature.
Detractors: Customers who selected a rating between 0 and 6. These are unsatisfied customers who’re likely to leave a negative review for your brand.
NPS is the difference between the percentage of your promoters and detractors.
NPS = % Promoters - % Detractors
NPS scores can range between +100 (all promoters) and -100 (all detractors). Scores also vary substantially by industry. For example, the average NPS for auto dealerships is 40, while it’s only 24 for rental car businesses. Compare your NPS score against the average NPS score of your industry rather than looking at absolute values. This will give you a better understanding of how you compare against your peers.
Here’s a graph showing the NPS scores of various industries.
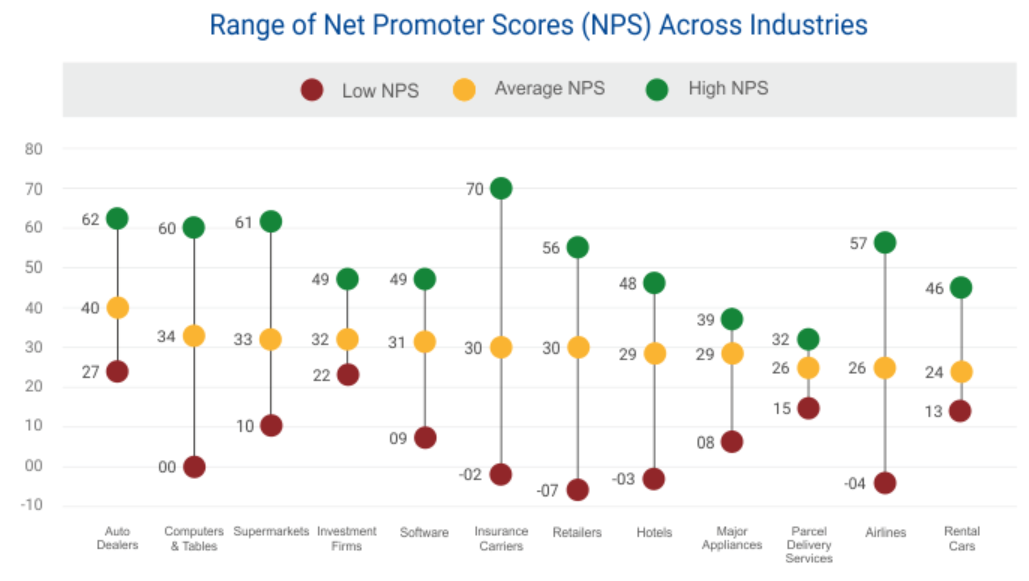
NPS scores across industries (Source)
You can also track NPS over a specific period of time to check if your customer satisfaction initiatives are bearing fruit (e.g., before and after launching a campaign).
Pros and cons of NPS
NPS is used widely to measure customer satisfaction, but it has its limitations. Here are some of its pros and cons.
| Pros | Cons |
|---|---|
| Is a good indicator of revenue growth | Promoters may not make actual recommendations without an incentive |
| Can be used for specific products or services as well as the overall brand | Doesn’t help pinpoint any one particular issue, as the score covers a broad scope |
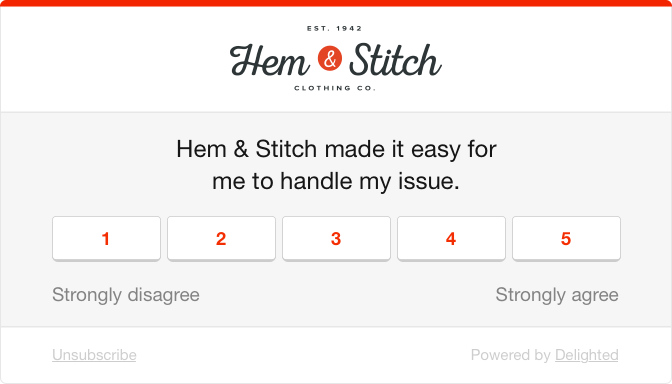
3. Customer effort score (CES)
CES is based on a survey question that asks customers how difficult it was to get their query or complaint resolved. It’s different from the other two methods, in that it uses a negative parameter to measure customer sentiments.
Q: How hard did you have to work to get a problem fixed, a query answered, or a service rendered?
The answer choices can be a five-point or seven-point numeric scale.
The customer effort score is calculated as the average of the scores given by all responding customers.
CES = Sum of individual customer effort scores / Total number of responses
CES surveys are generally used immediately after a customer’s interaction with your product, service, or sales team. They help understand the challenges faced by customers in getting a service. A higher score indicates better customer satisfaction.
According to Gartner, 96% of customers who experience a high-effort service interaction become more disloyal to a brand or company compared to only 9% of customers who have a low-effort experience. Long wait times, repetitive processes, and the need to switch channels to complete a purchase are examples of high-effort service interactions that can upset your customers.
Pros and cons of CES
Let’s discuss the pros and cons of CES, so you get a better idea of when to use it.
| Pros | Cons |
|---|---|
| Helps identify which customer service interaction or process is high effort | Doesn’t provide a customer’s overall opinion of your business |
| Aids in predicting customer loyalty and behavior | Doesn’t segment customers to pinpoint which types or categories are experiencing service issues |
Tools to measure customer satisfaction
You can use the tools mentioned in this section to collect data for calculating CSAT, NPS, and CES. You can also use them to get feedback about customers’ buying experience, your customer service, the pain points customers face in accessing your product or service, and what improvements customers would like to see in your business.
1. Survey tools
Survey tools, such as Google Forms, can be used to collect customer feedback on any topic. You can ask a single question or multiple (any number) questions. Surveys let you collect responses to both open-ended and closed-ended queries (e.g., multiple-choice, drop-down, check-box). You can have an in-app customer satisfaction survey or share the survey link via email.
2. Feedback forms or web forms
A web form is another tool that helps collect responses from customers. Unlike surveys, web forms are more suited to collect answers to only a limited number of questions (2-3 recommended). You can embed a web form on your website to capture customer feedback. You can also use it for NPS, CSAT, and CES questions.
3. Chat and other communication tools
You can communicate with customers via channels such as live chat, telephone, and email to know more about the challenges they face or what they like about your product. Regular conversations, through any channel, will help you stay up to date with customer preferences and pain points.
4. Data analytics
Analysis of customer interactions, shopping and browsing patterns, and other data can help unearth vital information about your clients. Your CRM software may offer built-in data analytics to help generate insights and reports. You can also use any other BI tool, such as Exago BI or Sisense, to analyze customer data.
5. In-person communication
Chatting face-to-face with buyers who come to your store is another good way to understand overall customer satisfaction levels. Train your sales staff to ask the right questions to customers, understand their body language, and offer proactive assistance to build better relationships.
Discover how to allow feedback to drive business decisions and become more customer-focused.
Case study: How Ford Europe achieved “best-in-class” customer satisfaction
Ford wanted to understand how satisfied customers were with its brand in Europe. It partnered with TTi Global, a business solutions service provider, to implement a customer satisfaction program. Together, they built the Customer Viewpoint Performance Management Tool (CVPMT) to collect satisfaction data from Ford’s European retailer network.
CVPMT collected feedback data from 5,700 dealers. Some of the info collected included overall sales and customer service satisfaction scores, customer satisfaction key drivers, and net promoter scores. The tool also reported data by region, dealer, and market.
Understanding customer satisfaction drivers helped Ford Europe identify opportunities to improve client satisfaction and lower the churn rate. The company has since seen year-on-year growth in the number of customers who rate the Ford Ownership experience as “best in class.”
What should you do next?
Like Ford, are you ready to find out if your customers are happy with your product or service? Use the metrics discussed above to know for sure.
Also, check out our customer satisfaction software directory to find a tool dedicated to measuring customer happiness levels. We also have customer experience and CRM solutions with built-in survey and feedback functionality to help you collect customer satisfaction data.
Once you have your metrics and data in place, work toward improving your customer experience strategy based on the feedback you’ve received.
Gitanjali Maria